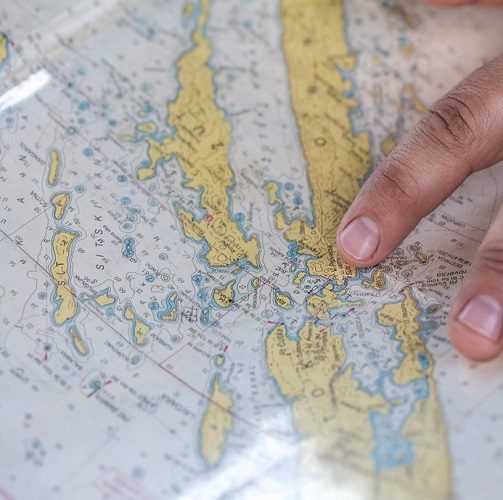
Geographic Information System

Engineering & Construction
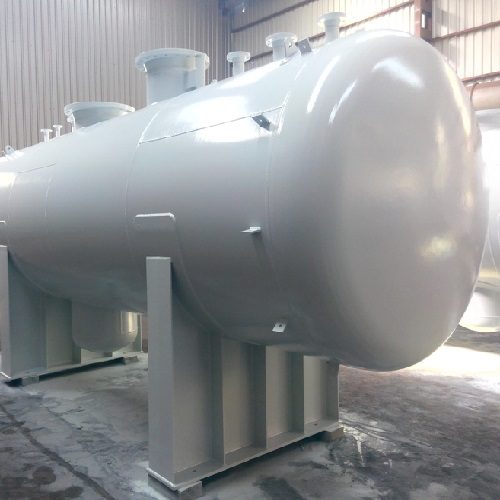
Storage Tanks
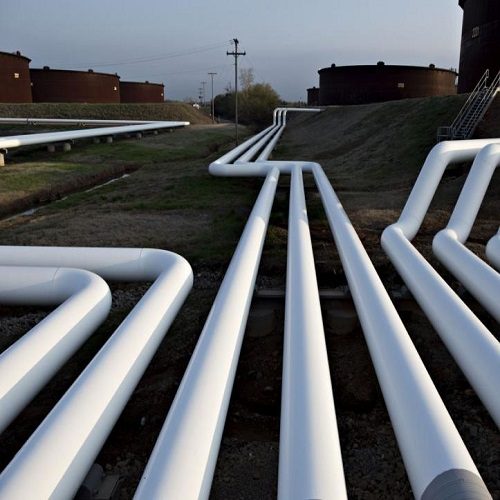
Pipeline Construction


Geographic Information System
What can we do with GIS?
GIS can be used as tool in both problem solving and decision making processes, as well as for visualization of data in a spatial environment. Geospatial data can be analyzed to determine (1) the location of features and relationships to other features, (2) where the most and/or least of some feature exists, (3) the density of features in a given space, (4) what is happening inside an area of interest (AOI), (5) what is happening nearby some feature or phenomenon, and (6) and how a specific area has changed over time (and in what way).
1. Mapping where things are. We can map the spatial location of real-world features and visualize the spatial relationships among them. Example: below we see a map of frac sand mine locations and sandstone areas in Wisconsin. We can see visual patterns in the data by determining that frac sand mining activity occurs in a region with a specific type of geology.
2. Mapping quantities. People map quantities, such as where the most and least are, to find places that meet their criteria or to see the relationships between places.
4. Finding what is inside. We can use GIS to determine what is happening or what features are located inside a specific area/region. We can determine the characteristics of “inside” by creating specific criteria to define an area of interest (AOI). Example: below is a map showing a flood event and the tax parcels and buildings in the floodway. We can use tools like CLIP to determine which parcels fall inside the flood event. Further, we can use attributes of the parcels to determine potential costs of property damage.
5. Finding what is nearby. We can find out what is happening within a set distance of a feature or event by mapping what is nearby using geoprocessing tools like BUFFER. Example: below we see a map of drive times from a central location in the City of Madison, WI. We can use streets as a network and add specific criteria like speed limit and intersection controls to determine how far a driver can typically get in 5, 10, or 15 minutes. (Map courtesy of UW Extension)
6. Mapping change. We can map the change in a specific geographic area to anticipate future conditions, decide on a course of action, or to evaluate the results of an action or policy. Example: below we see land use maps of Barnstable, MA showing changes in residential development from 1951 to 1999. The dark green shows forest, while bright yellow shows residential development. Applications like this can help inform community planning processes and policies.
Construction
Construction is a systematic and complex industry that requires managing the complexities inherent. We help our clients realize their vision by managing the complexities in every construction and becoming a trusted member of the team. We have experience in various construction sector and professional foreign partners in Europe and The Middle East. Our services include:
Project Management
- Construction Management
- Cost Estimation (Quantity Surveying)
- Valuation
- Urban Planning
- Land-Use Planning
- Feasibility Studies (Technical & Financial)
- Sustainability Initiatives
- Economic Impact Analysis